Authors: Yonglin Zhu and Anuja Nagpal
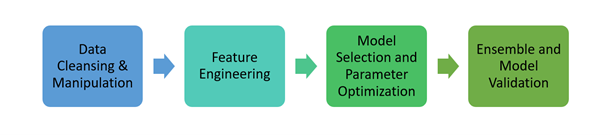
Whether you are a manager, domain expert, or another organizational decision-maker, your role requires making data-driven decisions daily. Traditionally, data science projects are tackled by coding each step of the machine learning pipeline, often iteratively. The high-level steps are shown in Figure 1. These tasks can be time-consuming and require programming language fluency, knowledge of the latest machine learning libraries, and so on. Even if you are an experienced programmer and machine learning expert, you always need to test the best way to preprocess the data. You will also need to create new features based on your data with various parameter combinations for each method.
With so many possible combinations of data preprocessing, feature engineering, and modeling, the entire process becomes tedious and overwhelming. However, applications like Model Studio in SAS Viya provide an intuitive user interface where you can create and customize a data science pipeline with only a few clicks. You can also leverage predefined pipeline templates for various tasks and targets instantly.
Additionally, for those who do not want to craft the whole pipeline but still want to find an effective one for their project, Machine Learning Pipeline Automation through Model Studio is the solution.
Machine Learning Pipeline Automation (MLPA)
Machine Learning Pipeline Automation (MLPA) does all the heavy lifting to create an effective pipeline for you in a few minutes. It intelligently scans the data to assign appropriate roles like date, text, partition, classification, and so on to utilize data to its full potential. This enables business users to easily automate sophisticated end-to-end pipelines, thereby enabling organizations to focus on more complex issues.
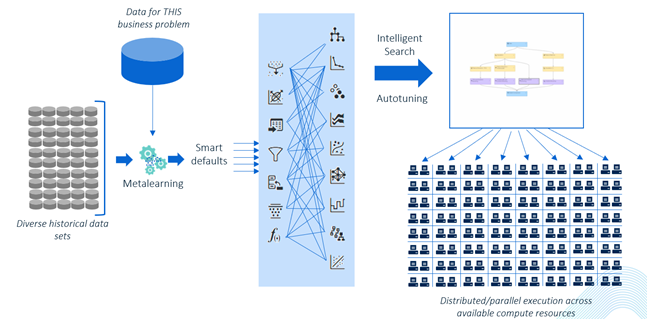
MLPA handles data preprocessing and feature engineering automatically. As shown in Figure 2, instead of building candidate models with sets of default configurations, MLPA uses meta-learning where pretrained models are used to warm-start diagnostic models with smart defaults. This jumpstarts the model’s learning by choosing an effective starting point.
It then further tunes the candidate models intelligently with the autotune process utilizing parallel execution across available computing resources.
The generated pipeline and results provide insights that are ready for decision-making. In short, MLPA helps you to drive through the forests of data with the steering wheel still in your hands.
MLPA's capabilities
For this post, this Top Rated TV Shows data set is used as an example to showcase MLPA's capabilities. This data set contains a list of the most-watched TV shows worldwide with ratings, popularity, and other attributes. The goal is to predict which TV shows are the most popular based on factors, for example, vote count, vote average, and show description. The ‘popularity’ variable, a metric that measures popularity based on customer views, is used as an interval target. A higher value of this variable indicates more popularity.
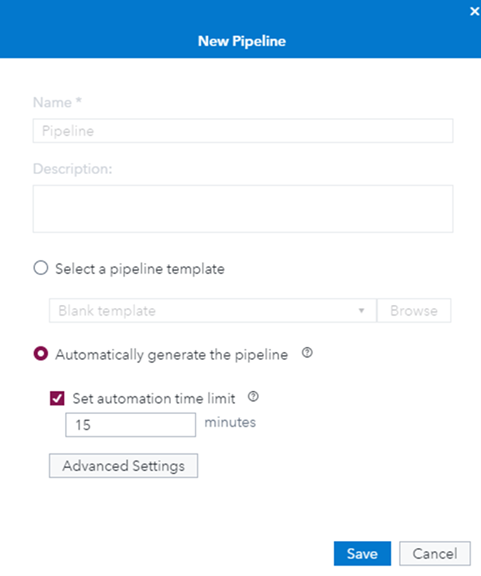
First, the data set is imported to create a new pipeline. Then the option “Automatically generate the pipeline” is chosen with the default time limit (15 minutes) as shown in Figure 3.
MLPA uses the time specified to build the pipeline based on your data. The automation process begins with data preprocessing and feature engineering. For this data set, MLPA automatically detects the variable “overview” as a Text column. It processes the text information and creates quantitative representations (singular value decomposition matrix) of the text for further use like modeling. Similarly, It also detects “first_air_date” as the Date column to extract additional information like year, quarter, month, and weekday to be used by further nodes.
MLPA then applies meta-learning followed by hyperparameter tuning. Finally, at the end of the pipeline, top models are ensembled to check if they produced a better fit. All the modeling nodes, including the ensemble model, are followed by a model comparison where the assessment is performed. After choosing the top models, it spends the leftover time, in the end, to further autotune using a genetic algorithm search approach.
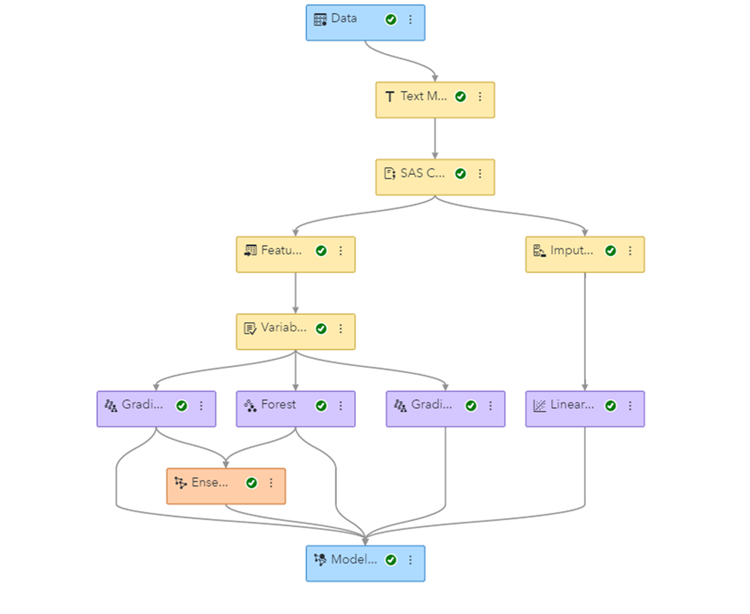
Once the pipeline is generated and finished running, as seen in Figure 4, all the nodes, along with their property settings, can be seen. This pipeline was curated by trying numerous combinations of models and their settings to find the champion model for this data set. The computationally expensive exploration of various candidate pipelines in parallel was possible with the distributed and parallel computing of SAS Viya.
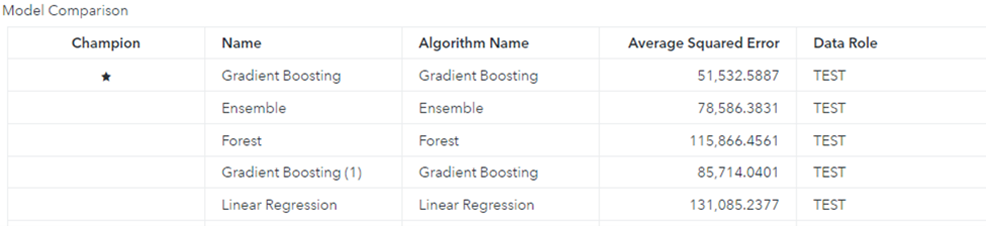
Let's look at the model comparison results shown in Figure 5. It shows that Gradient Boosting is the champion model based on the default Average Squared Error statistic for the popularity interval target on the TEST partition. You can also dive into each model’s details by looking at their results and parameters to understand the pipeline.
Although the intent of MLPA is to avoid the need to think about what needs to be included in the pipeline, MLPA does give you some control over what a pipeline should do and include.
First, as mentioned, you can set the amount of time it enables to curate the pipeline.
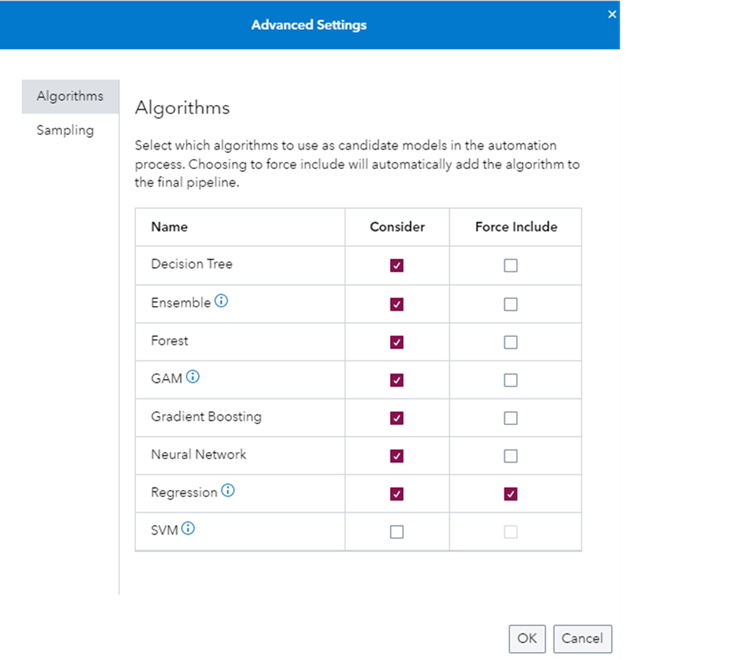
Second, it allows you to exclude or include any specific model through advanced settings, as shown in Figure 6. Note that by default, a Regression model is included for interpretability purposes.
Lastly, you can achieve the same results by using the Machine Learning Pipeline Automation REST API, which is a set of endpoints that enable you to control additional parameters that are not available in the Model Studio user interface.
After MLPA builds the pipeline, you can also expand your knowledge by unlocking the pipeline and modifying existing node parameter settings or by adding new nodes. You can also take one step further by adding an open source code node with Python or R code to compare with other models.
In summary, without any code, MLPA finds an effective pipeline for this data set after applying data preprocessing, feature engineering, and modeling with hyperparameter tuning within the given timeframe.
Summary
Machine Learning Pipeline Automation leverages various technologies that SAS Viya offers to provide an optimal pipeline for your project in minutes. It is an ultramodern solution to jumpstart your data science project. It quickly creates ready-to-deploy pipelines so that you can focus on other important aspects of your business. We would love to hear how the Machine Learning Pipeline Automation can help with your data science project journey. Feel free to use the Comments section below.
LEARN MORE | Automation in SAS Visual Data Mining and Machine Learning
LEARN MORE | MLPA Example Using the SAS Model Studio User Interface
Anuja Nagpal is a Machine Learning Developer in the Advanced Analytics division of SAS R&D. Her main focus is Machine Learning Pipeline automation. Previously, she worked as an analytical consultant at SAS helping customers solve their business problems by applying machine learning algorithms and statistical modeling techniques in various industries.